Por favor, deja tus datos y te contactaremos a la brevedad.
Client
The client, EpiQMAx, is a Germany-based biotechnology company that provides platforms and analytical services for the detection and quantification of histones and their epigenetic modifications using mass spectrometry. They serve pharmaceutical companies, clinics, and scientific labs.
Business Challenge
The client wanted to extend the scope of their analytical services. They were looking for a technology partner to help them create a user-friendly software for data visualization solution that would grant their customers access to data from mass spectrometry measurements.
Accepting and Meeting the Challenge
DataArt had to both understand EpiQMAx’s business concerns and enhance its existing services. We created a state-of-the-art software for data visualization, providing feature-rich mass-spectrometry data analysis that leveraged modern principles of user experience (UX) and user-centered design (UCD):
- Eight chart types with multitudes of configuration possibilities
- Flexible mechanism for data inputs mapping for axes
- Various charts layout configuration possibilities tailored to data visualization in healthcare needs
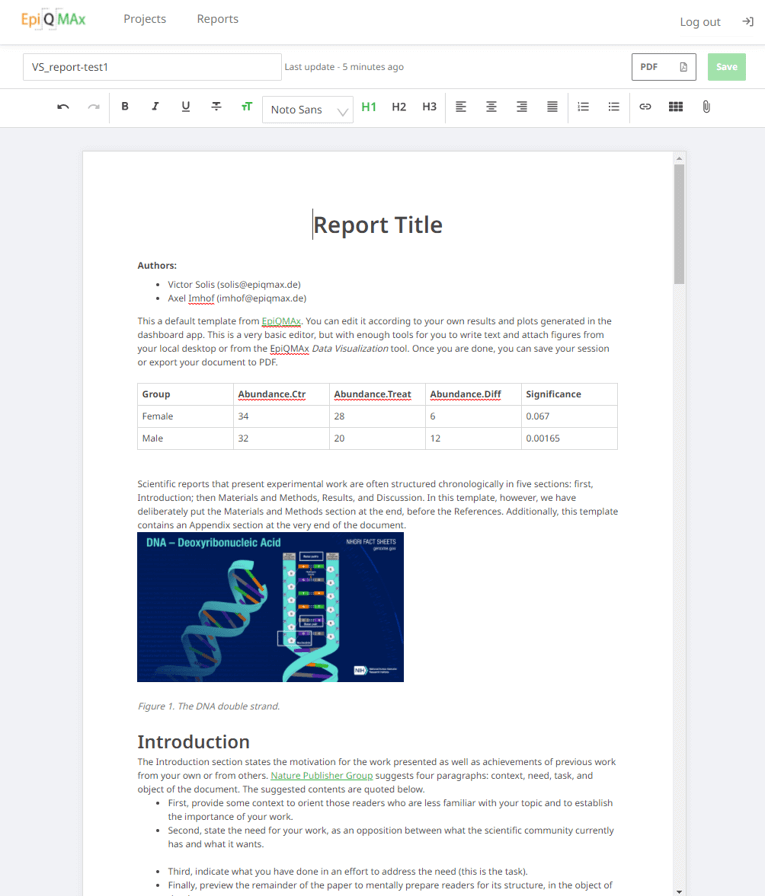
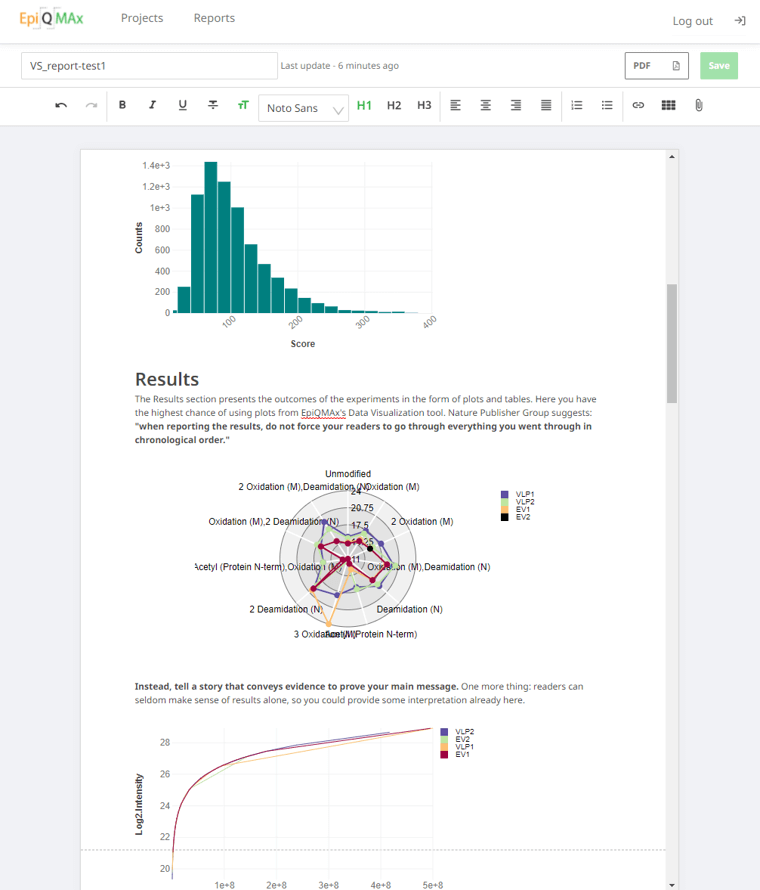
- PDF report generator with editing capabilities:
- a professional final view of the data
- charts, tables, images, and free text combined in a single document
DataArt delivered an operational and attractive web-based software for data visualization that stands out for its flexibility and usability, giving the company a competitive edge, leaving it well positioned in the industry.
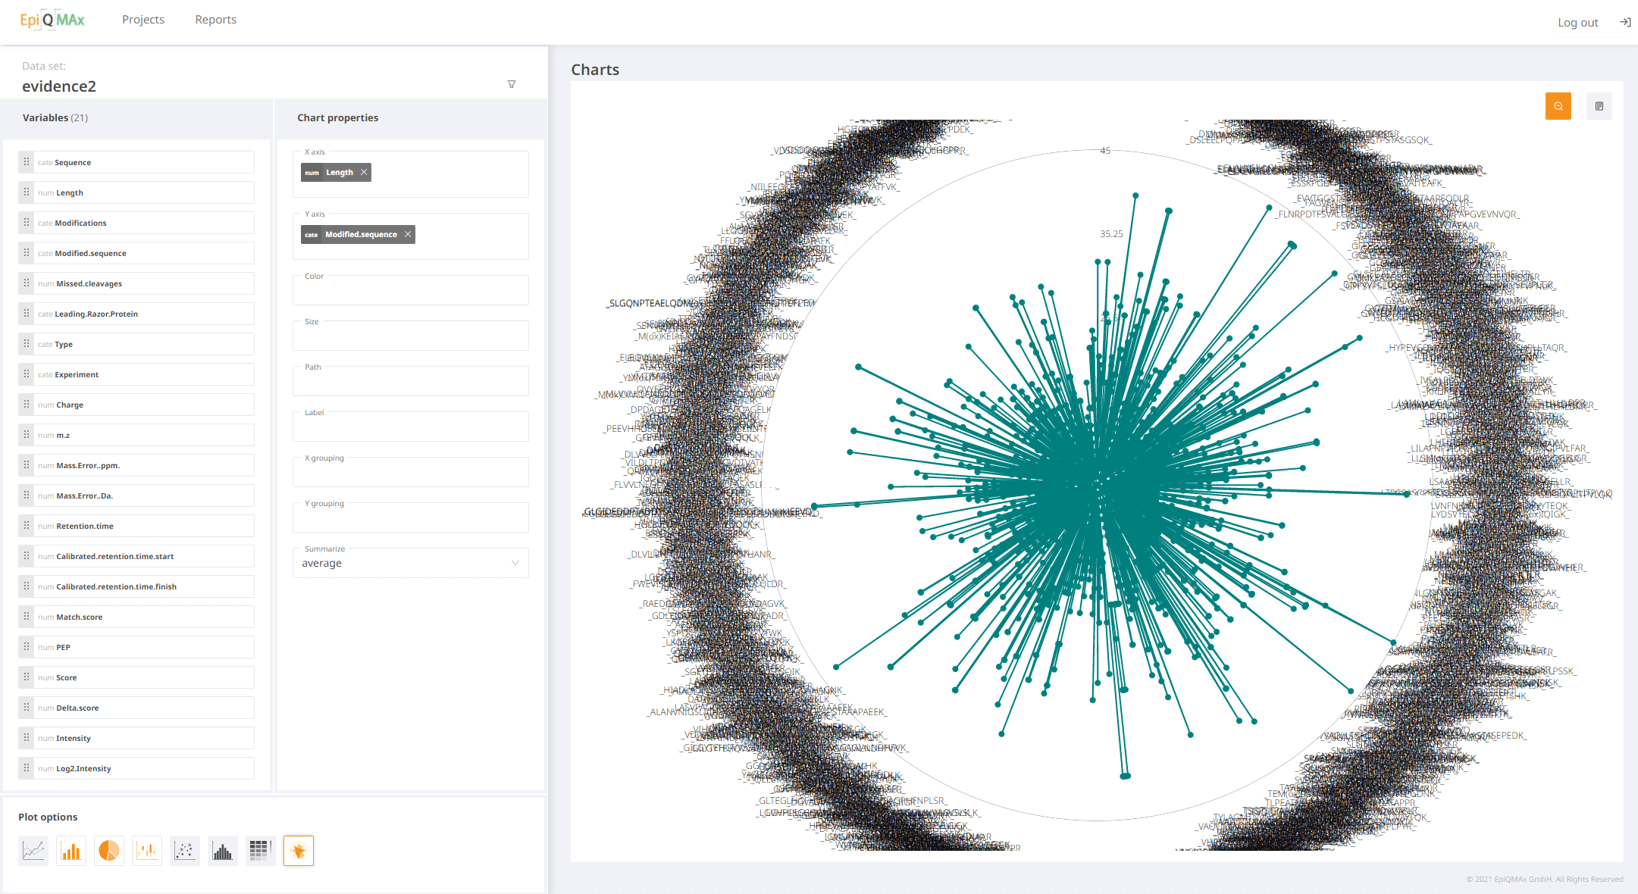
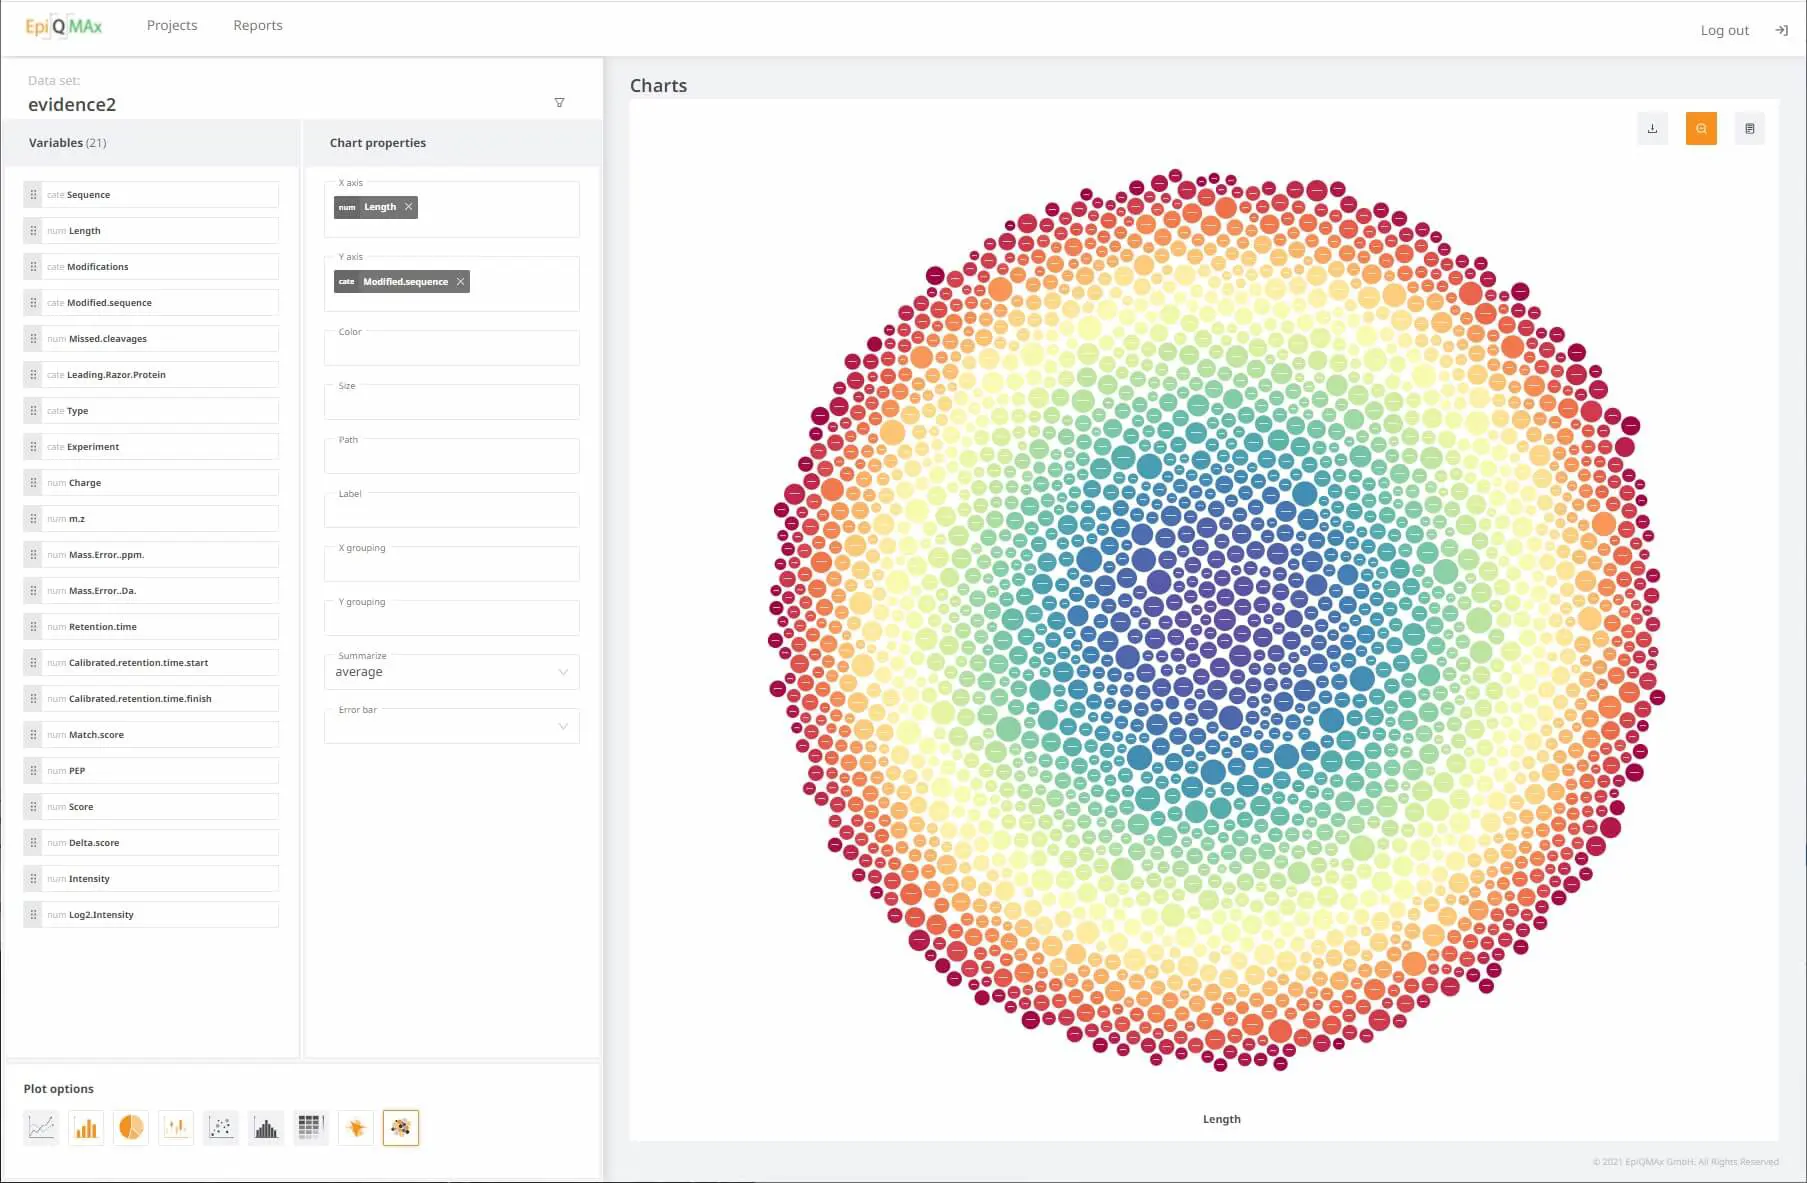
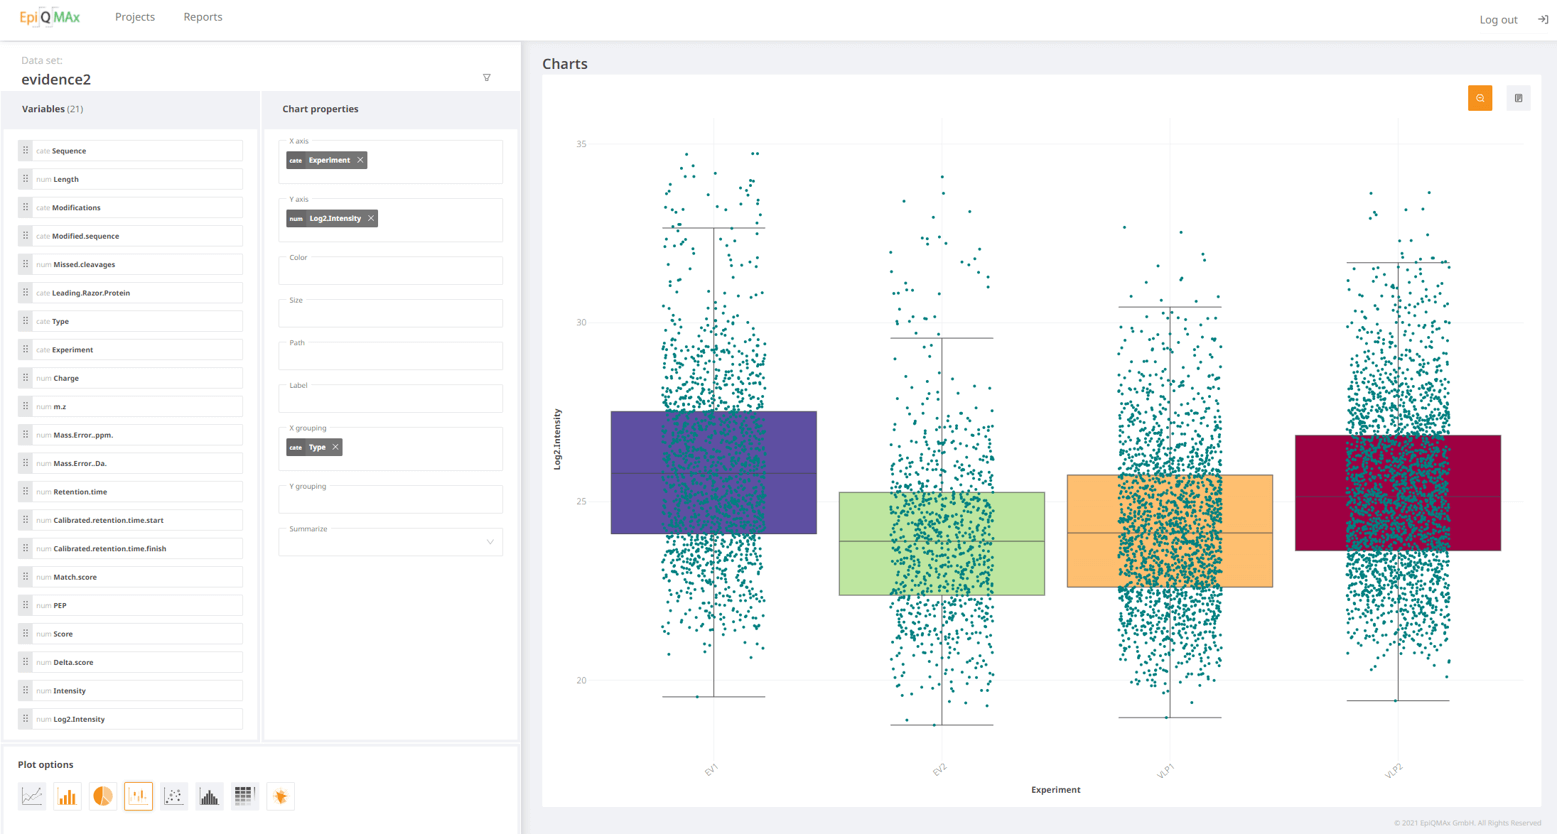
The screenshots below are from the actual system and offer examples of the system’s representation of spectrometry analysis data.
Key Features
- Graphical View of Data (8 different plot options)
- Effective Reports Editor — Convertible into PDF
- Flexible Project Management Tailored for Data Visualization in Healthcare
- Navigate/ Break down/ Filter/ Analyze your data
- Product Differentiation
Technologies
ReactJS & D3.js on Front-end
PHP on Back-end


